How to group by week in pivot table?
When we group date in pivot table, we can group by month, day, quarter and year. In certain case, we need to group the data by week, how could you deal with this problem? Here, I will talk about some quick tricks for you.
Group by week in pivot table with setting 7 days as a week
Group by week in pivot table with a helper column
Group by week in pivot table with setting 7 days as a week
To group the data by week, you can set 7 days date from Monday to Sunday as a week, please do as follows:
1. After have created your pivot table, please right click any date in the pivot table, and select Group from the context menu, see screenshot:

2. In the Grouping dialog, please do the following options:
A: Under Auto section, type the starting date of one week. In this example, my first date is 2014-3-12 in my table, but it isn’t the first day of its week, so I change it to 2014-3-10 which is the first day of the week beginning from Monday. And the end date needn’t to modify;
B: Choose Days from the By list box;
C: Enter 7 to Number of days box.

3. And then click OK, and your data has been grouped by week as you want, see screenshot:

Group by week in pivot table with a helper column
In Excel, you can also add a helper column to calculate the week number which relative to the date, and then select the data range including this field to create a pivot table. Please do with following steps:
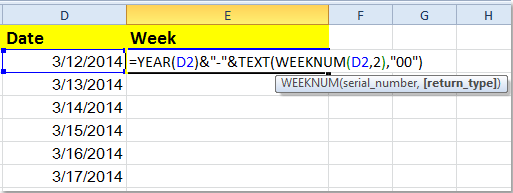
1. First, please calculate the week numbers to the date, enter this formula: =YEAR(D2)&"-"&TEXT(WEEKNUM(D2,2),"00") into a blank cell beside your data, (D2 indicates the date cell that you want to use), see screenshot:
2. Then drag the fill handle over the range that you want to apply this formula, and the week numbers have been filled in this helper column, see screenshot:

3. Then select the whole data range including the field you add in the above step that you want to use for creating pivot table, and click Insert > PivotTable > PivotTable, see screenshot:

4. In the Create PivotTable dialog, choose a new worksheet or a range of current worksheet to place the pivot table under Choose where you want the PivotTable report to be placed section.

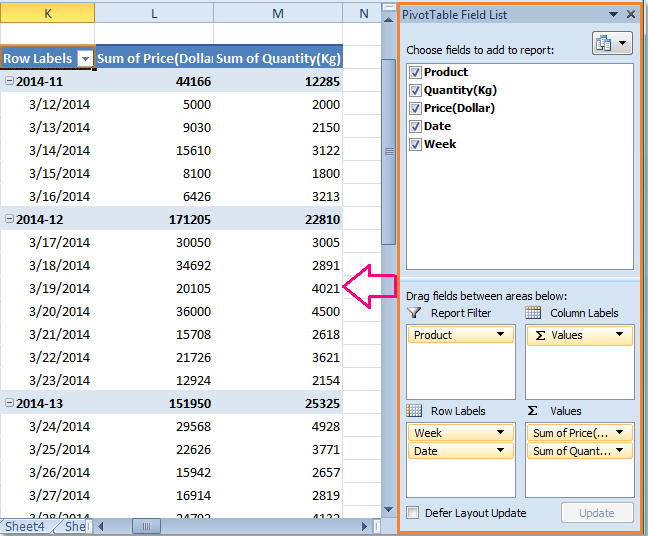
5. Click OK, then drag the fields to their relative field list box and put the Week field at the top in the Row Labels section, and you can see the data has been grouped by the week, see following screenshot:
Best Office Productivity Tools
Supercharge Your Excel Skills with Kutools for Excel, and Experience Efficiency Like Never Before. Kutools for Excel Offers Over 300 Advanced Features to Boost Productivity and Save Time. Click Here to Get The Feature You Need The Most...
Office Tab Brings Tabbed interface to Office, and Make Your Work Much Easier
- Enable tabbed editing and reading in Word, Excel, PowerPoint, Publisher, Access, Visio and Project.
- Open and create multiple documents in new tabs of the same window, rather than in new windows.
- Increases your productivity by 50%, and reduces hundreds of mouse clicks for you every day!
All Kutools add-ins. One installer
Kutools for Office suite bundles add-ins for Excel, Word, Outlook & PowerPoint plus Office Tab Pro, which is ideal for teams working across Office apps.
- All-in-one suite — Excel, Word, Outlook & PowerPoint add-ins + Office Tab Pro
- One installer, one license — set up in minutes (MSI-ready)
- Works better together — streamlined productivity across Office apps
- 30-day full-featured trial — no registration, no credit card
- Best value — save vs buying individual add-in