How to reorder chart series in Excel?
When you insert a chart in Excel, the sequence of data series displayed on the chart is, by default, determined by the order of data columns from your original dataset. However, you might need to adjust the appearance or clarity of your chart by changing the order of these series. For example, you may want to highlight specific categories by moving them forward or backward in the legend or stack order, or match a preferred presentation style. This guide will walk you through several practical methods to reorder chart series in Excel, including both manual and automated approaches, and offers insights into typical usage scenarios, tips, and troubleshooting suggestions.
➤ Reorder chart series (Select Data dialog)
➤ VBA: Programmatically reorder chart series
Reorder chart series (Select Data dialog)
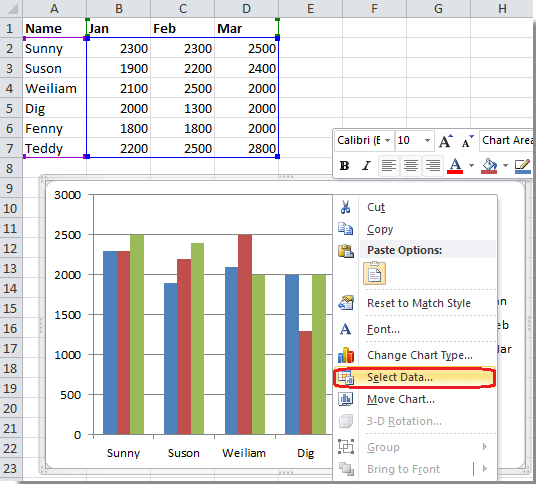
To change the order in which chart series appear in Excel, you can use the Select Data dialog. This method is especially useful for visually adjusting the series order in common chart types such as column, line, or bar charts. It’s simple, requires no coding, and works well for charts with a manageable number of series.
However, if you frequently reorder charts or manage large datasets, consider the VBA-based solution later in this article.
Steps:
1. Right-click your chart and select Select Data from the context menu.
2. In the Select Data dialog, choose the series to reorder under Legend Entries (Series). Use the Move Up (▲) or Move Down (▼) buttons to reposition the selected series.

3. Click OK to apply the changes. Your chart will now reflect the new series order both visually and in the legend.
 |
 |
📌 Tips and Reminders:
- Label your data clearly to avoid confusion when reordering series.
- Changes are previewed live in the chart—feel free to experiment before clicking OK.
- If the Move Up/Down buttons are disabled, make sure a series is selected and that the chart type supports reordering.
- Certain chart types (e.g., combo charts) may have limited reordering capabilities.
If you frequently reorder series across multiple charts or want to automate this process, continue to the VBA-based solution below for advanced control.
VBA: Programmatically Reorder Chart Series
For users who work with multiple charts or need to automate the reordering of chart series, VBA (Visual Basic for Applications) provides an efficient solution. This approach is ideal if you:
- Frequently reorder series in dashboards or recurring reports
- Manage multiple charts across worksheets or workbooks
- Want to standardize the order of chart series automatically
Using VBA saves time but requires enabling macros and having some familiarity with the VBA editor. Always save your workbook before running a macro.
Step 1: Press Alt + F11 to open the Visual Basic for Applications editor.
Step 2: In the editor, go to Insert > Module to create a new code module.
Step 3: Copy and paste the following code into the module:
Sub ReorderChartSeries()
    Dim cht As Chart
    Dim desiredOrder As Variant
    Dim i As Long, j As Long

    ' Define the desired order (update series names as needed)
    desiredOrder = Array("Series2", "Series1", "Series3")

    ' Reference the first chart on the active sheet
    Set cht = ActiveSheet.ChartObjects(1).Chart

    For i = 0 To UBound(desiredOrder)
        For j = 1 To cht.SeriesCollection.Count
            If cht.SeriesCollection(j).Name = desiredOrder(i) Then
                cht.SeriesCollection(j).PlotOrder = i + 1
            End If
        Next j
    Next i
End Sub
Step 4: Press F5 or click the ![]() Run button to execute the macro. The chart series will be reordered according to the
Run button to execute the macro. The chart series will be reordered according to the desiredOrder array.
You can modify the desiredOrder array to match your own series names. Be sure the names exactly match those shown in your chart legend.
📌 Notes & Troubleshooting:
- If your workbook contains multiple charts, change
ChartObjects(1)to target another chart or loop through all charts on the sheet. - To check actual series names, select the chart and use the Select Data dialog.
- If the macro fails to reorder, verify that macros are enabled and the series names are correctly spelled.
- Always test VBA scripts on a backup copy to prevent data loss.
This VBA method is highly useful for automating chart formatting tasks, especially in reporting workflows that require consistency across multiple visuals.
Relative Articles:
Best Office Productivity Tools
Supercharge Your Excel Skills with Kutools for Excel, and Experience Efficiency Like Never Before. Kutools for Excel Offers Over 300 Advanced Features to Boost Productivity and Save Time. Click Here to Get The Feature You Need The Most...
Office Tab Brings Tabbed interface to Office, and Make Your Work Much Easier
- Enable tabbed editing and reading in Word, Excel, PowerPoint, Publisher, Access, Visio and Project.
- Open and create multiple documents in new tabs of the same window, rather than in new windows.
- Increases your productivity by 50%, and reduces hundreds of mouse clicks for you every day!
All Kutools add-ins. One installer
Kutools for Office suite bundles add-ins for Excel, Word, Outlook & PowerPoint plus Office Tab Pro, which is ideal for teams working across Office apps.
- All-in-one suite — Excel, Word, Outlook & PowerPoint add-ins + Office Tab Pro
- One installer, one license — set up in minutes (MSI-ready)
- Works better together — streamlined productivity across Office apps
- 30-day full-featured trial — no registration, no credit card
- Best value — save vs buying individual add-in