Quickly add horizontal or vertical average line to a chart in Excel
Kutools for Excel
Boosts Excel With 300+
Powerful Features
When you create a column or bar chart in Excel worksheet, sometimes, you may want to add an average or a target line for comparing with the column or bar values. Normally, with the built-in feature in Excel, you need to insert an average bar or column data, and then change the bar to line type, but, in this article, you will get a powerful feature-Add Line to Chart of Kutools for Excel, with the help of this utility, you can add a horizontal or vertical average or specific value line to the column or bar chart with ease.
Quickly add horizontal or vertical average or specific value line to chart in Excel
Quickly add horizontal or vertical average or specific value line to chart in Excel
Please do with the following steps for adding the average or specific value line to a chart:
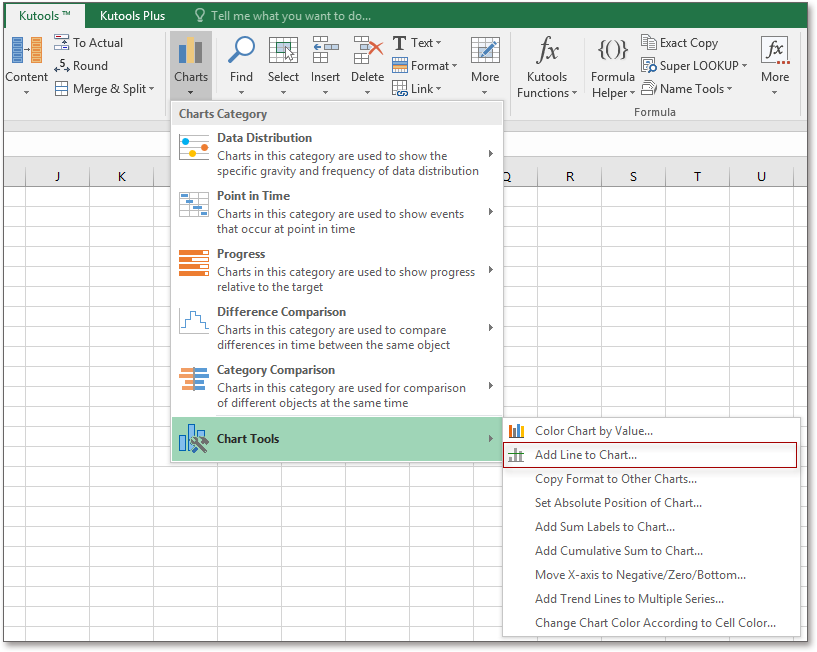
1. First, create a column or bar chart based your data, then click to select the created chart, and then, click Kutools > Chart > Chart Tools > Add Line to Chart, see screenshot:
2. In the Add line to chart dialog box, select Average or Other values you need from the Where to insert section, in this example, I will select Average option, see screenshot:
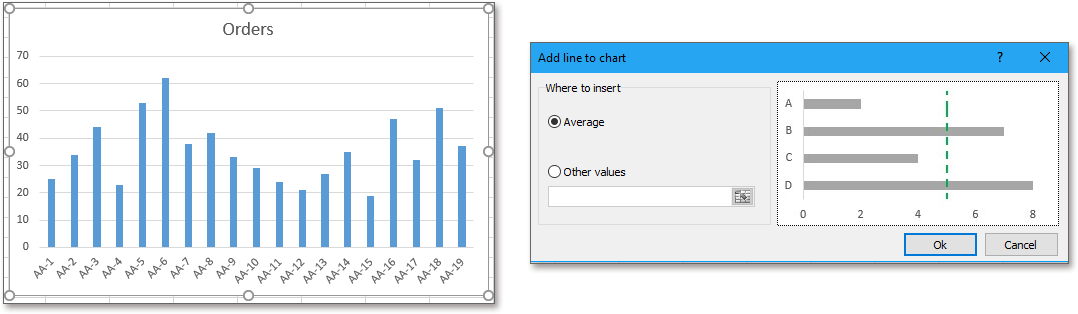
3. Then, click Ok button, a horizontal average line will be inserted into the column chart at once, see screenshot:

Notes:
1. If you have a bar chart, after selecting the Average or specifying a certain value in the Other value textbox as following screenshot shown:

And a vertical specific value line will be added into the bar chart, see screenshot:

2. You can change the color or type of the line to your need as following screenshot shown:

3. This line is static, it will not change when the original data changes, so, if your original data changes, you should apply this feature again to get the correct result.
Add horizontal or vertical average line to a chart
The following tools can greatly save your time and money, which one is right for you?
Office Tab: Using handy tabs in your Office, as the way of Chrome, Firefox and New Internet Explorer.
Kutools for Excel: More than 300 Advanced Functions for Excel 2021, 2019, 2016, 2013, 2010, 2007 and Office 365.
Kutools for Excel
The functionality described above is just one of 300 powerful functions of Kutools for Excel.
Designed for Excel(Office) 2021, 2019, 2016, 2013, 2010, 2007 and Office 365. Free download and use for 30 days.

![]()
![]()
![]()